
PODCAST
How to understand current Economic Threats to your business and make it strategically grow.
This is not financial or medical advice. Through its proprietary research Insight Matrix, NCM collates and researches financial subjects and produces these podcasts for quick efficient delivery of information.

The Latest Video Update
A quick overview of NCM’s subscription based Economic Fragility Index Monitor
Why a Low Score Is a Warning, Not Reassurance 260926
Five parts: the illusion of calm as a deceptive baseline; the Paradox Rule, which blocks a "clean" reading when credit markets are pricing calm into a genuinely constrained environment; active risk modifiers that shift capital allocation by risk profile (Aggressive, Growth, Balanced, Conservative) and by live inputs like valuation multiples, capital flow restrictions and energy prices; technical divergence, where a restriction holds even as an indicator improves, because the cost of being wrong is asymmetric; and physical vs financial reality, contrasting real-world shocks (crude spiking over 20%, record diesel margins) against a credit spread that barely moved. Closes on the open question the whole series is built around: will the spread eventually reflect reality, or stay suppressed.Show More
Now Playing
Why a Low Score Is a Warning, Not Reassurance 260926
Part D of the EFI Monitor R&D series, restricted to the ...
Part D of the EFI Monitor R&D series, restricted to the academic/technical methodology behind the framework. This one pulls back the curtain on how the Insight Matrix scoring system actually ...works and why a calm headline number can still mean rising risk.
Five parts: the illusion of calm as a deceptive baseline; the Paradox Rule, which blocks a "clean" reading when credit markets are pricing calm into a genuinely constrained environment; active risk modifiers that shift capital allocation by risk profile (Aggressive, Growth, Balanced, Conservative) and by live inputs like valuation multiples, capital flow restrictions and energy prices; technical divergence, where a restriction holds even as an indicator improves, because the cost of being wrong is asymmetric; and physical vs financial reality, contrasting real-world shocks (crude spiking over 20%, record diesel margins) against a credit spread that barely moved. Closes on the open question the whole series is built around: will the spread eventually reflect reality, or stay suppressed.Show More

Now Playing
EFI Monitor The Credit Market Paradox - 24 Paradox 250926
Issue 24 of the Economic Fragility Index Monitor breaks down the ...

Issue 24 of the Economic Fragility Index Monitor breaks down the current paradox in markets: credit spreads sit at a calm 2.68%, even as the Fed hikes to 3.75–4.00%, the ...10-year Treasury crosses 5% for the first time this cycle, and oil spikes to $114.89 a barrel after a drone strike on a Saudi pipeline.
We walk through the "Avalanche Index" mechanism — how weak structural layers build quietly under a solid-looking surface until a small trigger sets off a much bigger slide — plus historical analogues from 1929, 2000 and 2007, and the four forward-looking risk scenarios (credit repricing, energy tightening, valuation drops, property credit fragility) now in play.Show More

Now Playing
Private Credit Risk for Australian Super 250926
This issue of the Economic Fragility Index Monitor exposes a widening ...
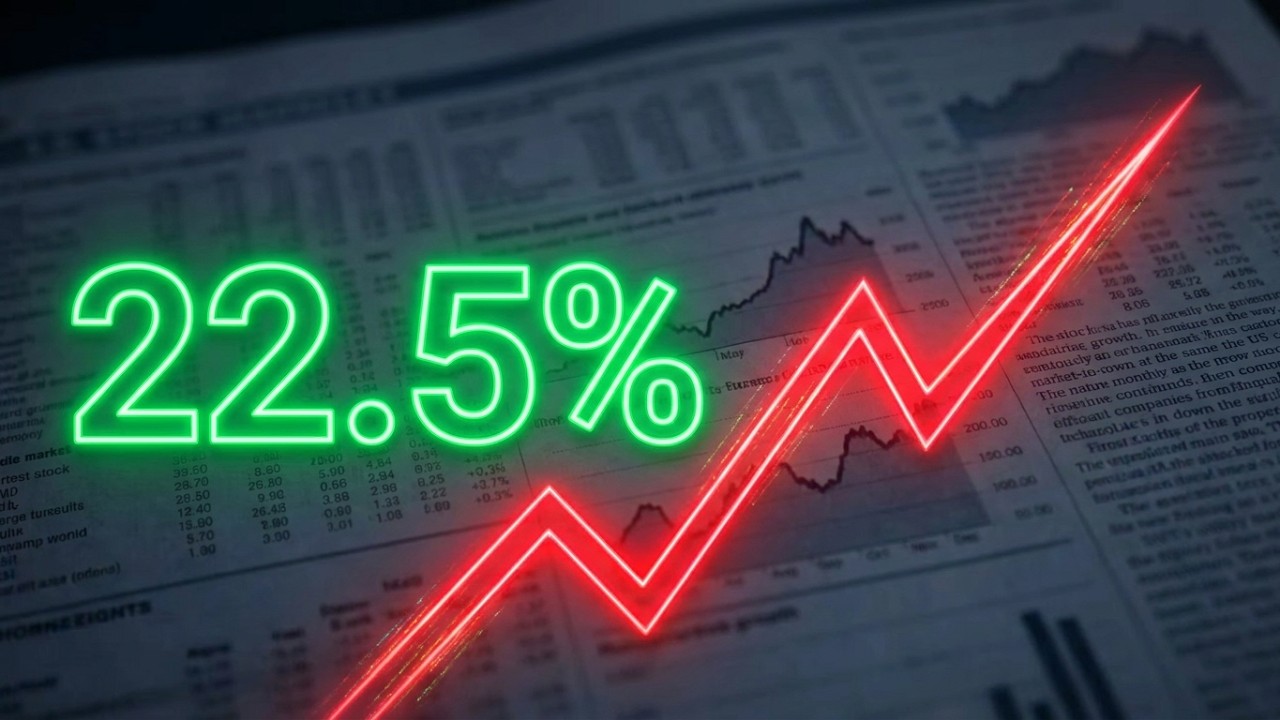
This issue of the Economic Fragility Index Monitor exposes a widening gap between the reported risk score and what's actually building underneath it. The headline fragility score has held flat ...at 22.5% for six consecutive issues, even as structural loading climbs to a record.
We trace the evidence: liquidity gates slamming shut at major private credit managers (Morgan Stanley, Cliffwater, Blue Owl Capital), PIK interest quietly capitalising instead of being paid down, NAV redemption limits being breached, and portfolio companies where operating costs have overtaken revenue. The close looks at how this risk crosses the Pacific, tracing the path from Australian superannuation capital through US intermediaries into private credit exposure.Show More

Now Playing
The Market Is Calm. The Economy Isn’t. | Episode 26 August 2026 Economic Fragility Index 280826
Why are stock markets near record highs while structural economic ...
Why are stock markets near record highs while structural economic indicators are flashing serious warning signs?
This August 2026 explainer examines the widening gap between market pricing and systemic economic risk ...through the Economic Fragility Index. The headline fragility score remains below the amber threshold, yet deeper structural indicators point to significant stress across commercial real estate, interest rates, consumer credit, banking, labor markets, energy and global manufacturing.
#EconomicFragility #SystemicRisk #StockMarket #EconomicCrisis #Economy2026 #CAPE #FinancialMarkets #Macroeconomics #MarketRisk #EconomicAnalysisShow More

Now Playing
Global Fragility Warning: The Structural Paradox Is Now Fully Active — EFI Monitor Issue 21 010726
The Economic Fragility Index Monitor — Issue 21 reveals one of the ...
The Economic Fragility Index Monitor — Issue 21 reveals one of the most important macro signals in years: a fully active Structural Paradox created by compressed credit spreads suppressing multiple ...Red structural indicators.
This month’s reading prints 22.5%, sitting in the Green Field band for the sixth consecutive issue — but the calm is deceptive. The sentinel high‑yield credit spread sits at 2.78%, only 22 basis points from the threshold that would simultaneously activate the Banking Solvency Veto, trigger the debt sustainability cascade multiplier, and force a discontinuous jump of 30–50 percentage points into Late Acceleration or Crisis territory.
Key insights covered in this edition:
The Defensive Lean override applied across all growth profiles
Commercial property stress and pre‑emptive restriction
Six‑month volatility compression signalling an imminent expansion
Breadth divergence between calm headline readings and worsening structural stress
Avalanche Index at the 94th percentile, with a forward transition probability of 40–55%
The Threshold Transition Velocity Function and Policy Suppression Asymmetry highlighted by live data
Historical analogue: the only precedent for this configuration is 2005–2007, immediately before the GFCShow More

Now Playing
US Economy’s Hidden Fragility EXPOSED — Credit Spreads 21bp From Trigger | EFI Issue 20 050626
The latest Economic Fragility Index (Issue 20) reveals a 22.5% Green ...
The latest Economic Fragility Index (Issue 20) reveals a 22.5% Green Field score, but beneath the surface the system is flashing structural warnings. Three major indicators remain Red — office ...vacancies at 17.7%, the Federal Funds Rate at 3.64%, and extreme market valuations (CAPE 40.72, Buffett Indicator 229.5%) .
Credit spreads sit at 2.79%, just 21bp from the Amber threshold, meaning the Debt Sustainability Trap and Banking Solvency Veto are armed and could activate simultaneously if spreads widen .
Markets now price an 85% probability of a Fed rate hike by year‑end, while China’s manufacturing PMI sits at the boundary and the China Credit Opacity Index remains Amber. This video breaks down the structural paradox: surface calm, deep systemic stress.Show More

Now Playing
The Iceberg Briefing: Why the “Green” Economy Signal Is a Massive False Positive 290526
The latest Economic Fragility Index Monitor (Issue 19) reveals a ...
The latest Economic Fragility Index Monitor (Issue 19) reveals a hidden structural crisis beneath today’s reassuring macro dashboard. Compressed credit spreads, collapsing real‑estate collateral, pipeline inflation, and sovereign‑level fiscal stress ...are forming a systemic iceberg that most allocators can’t see. This briefing breaks down the structural paradox trap, the three immediate portfolio threats, the inflation pipeline guarantee, and the defensive posture required to survive the next 12–18 months. This briefing exposes the hidden structural fragility masked by today’s deceptively “green” macro dashboard, drawing directly from the Economic Fragility Index Monitor Issue 19. By analysing credit spread compression, pipeline inflation transmission, valuation stress, and real‑estate collateral erosion, the video reveals why systemic risk is accelerating beneath the surface. Viewers gain a clear, data‑driven understanding of the structural paradox dynamics shaping the next 12–18 months of macroeconomic instability. This briefing explores the structural paradox dynamics driving credit spread compression, rising pipeline inflation transmission, and accelerating sovereign fiscal dominance.Show More

Now Playing
Global Economy: Structural Fragility (Commercial Real Estate, Inflation, China Shock) 220526
Key Insights Covered in This Video CAPE ratio at 41.87—levels seen ...
Key Insights Covered in This Video
CAPE ratio at 41.87—levels seen only in 1929 and 1999
Buffett Indicator at 233%, near all‑time highs
US office vacancy at 18.6%, well into the danger zone
Energy ...shock from the Strait of Hormuz closure
Foreign selling of US Treasuries hits USD 240B in one month
China entering a Balance Sheet Recession
Avalanche Index above the 80th percentile—a major structural stress alertShow More

Now Playing
The Market Is Lying: Why Sentiment Is Green but the Economy Is Red 15 May 2026
Are markets safer than they look — or are investors trapped in a ...
Are markets safer than they look — or are investors trapped in a dangerous sentiment illusion?
This video breaks down the widening disconnect between market optimism and structural economic ...stress, using insights from the Weighted Fragility Score, Avalanche Index, and Silicon Crowd Simulation.
Key Themes Covered
Why the WFS shows a “green field” despite deep structural red flags
How compressed sentiment indicators create a false sense of safety
The Rogoff–Reinhardt Amnesia Phase and why investors keep repeating history
Structural stress signals:
Office vacancy at 17.7%
CAPE ratio at 42.18 — rivaling dot‑com and 1929 levels
CMBS delinquency above 12%
30‑year Treasury yield at 5.04%
Private credit sector fragility across $1.88T in exposure
Sentiment vs Structural Reality
Markets are hitting highs, but fundamentals are deteriorating. This video explains why betting on sentiment means betting against structural constraints — a historically dangerous position.
Scenario Probabilities (Based on Model Simulations)
Stagflationary Continuation — 25.2%
Sudden Credit Cascade — 23.3%
Soft Landing — 9.5%
The takeaway: The soft landing narrative is the least supported by structural data.
Who This Video Is For
Institutional investors, portfolio managers, macro analysts, and anyone trying to understand the real risks beneath today’s market optimism.Show More

Now Playing
2026 Market Warning: Private Credit Risk & The Coming Valuation Shock Explained 080526 png
The 2026 EFI Monitor Issue 16 reveals one of the most unusual and ...
The 2026 EFI Monitor Issue 16 reveals one of the most unusual and dangerous macro‑financial configurations ever recorded — a Green Field headline score masking deep structural fragility. This video ...breaks down the Structural Paradox, where ultra‑compressed credit spreads coexist with three Red systemic indicators, including record‑level valuations and stressed real‑economy signals.
We explore:
Shiller CAPE at 41.83 — higher than 1929 and near the dot‑com peak
Buffett Indicator at 225.9%, near all‑time highs
Private credit market at USD 3.5T, now formally designated a systemic vulnerability by the FSB
Office vacancy at 17.7%, firmly in Red territory
EFFR at 3.625%, the most restrictive setting of the cycle with the most divided FOMC vote since 1992
Scenario probabilities, including a 40–65% chance of a major valuation correction within 6–18 months
You’ll learn why the report warns that compressed credit spreads are mathematically suppressing the fragility score, creating an artificial calm that does not reflect underlying risk.
This video covers:
The Structural Paradox and why it matters
Historical analogues: 1929, 1999–2000, 2007
How private credit could trigger a systemic event
Why the model shows 4‑method convergence on a valuation correction
The geopolitical wildcard: Iran peace framework and EPFI
What to watch next: credit spreads, energy prices, Fed leadership transition, and CMBS delinquency
If you want to understand the real macro risk landscape of 2026, this is the breakdown you need.Show More

Now Playing
9 Global Crises Collide: The 2026 Systemic Shock Explained — Oil, Helium, Credit Crunch & More
It’s late March 2026, and the global economy is being hit by something ...
It’s late March 2026, and the global economy is being hit by something we’ve never seen before — nine major crises all erupting at the exact same time. This video ...breaks down how a single geopolitical event triggered a chain reaction across energy, technology, finance, and global trade, creating what analysts call a systemic multiplier.
In this explainer, we unpack:
• The Strait of Hormuz shutdown — removing 20% of the world’s traded oil overnight
• The hidden helium crisis — Qatar’s supply trapped, threatening semiconductors, MRI machines, aerospace and more
• The $1.8 trillion private‑credit stress event — where 94% of defaults are being disguised as “distressed exchanges”
• Why regulators are sounding alarms about opaque valuations and blocked investor withdrawals
• How tech shutdowns and credit fragility feed directly into each other
• Why traditional risk models are breaking down in real time
• The four actions analysts say are now mandatory:
– Severe stagflation stress testing
– Direct custody verification
– Red‑team strategy validation
– Monitoring the global reserve shift
This is the 2026 perfect storm — a world where one chokepoint can simultaneously disrupt energy, technology, and finance. If you want to understand the forces reshaping the global economy, this is the breakdown you need.
Disclaimer: This video is for informational purposes only and is not financial, legal, or investment advice.Show More

Now Playing
Global Crisis 2026: Iran War, China Tariffs, Rare Earth Shock & IMF Warning — SVELTE Report 060526
The SVELTE Report – Global Intelligence Briefing (6 May 2026) reveals ...
The SVELTE Report – Global Intelligence Briefing (6 May 2026) reveals a world under extreme, overlapping stress across geopolitics, energy, trade, monetary policy, and global growth.
This video breaks down the ...six “high‑entropy outliers” identified in the report — each capable of reshaping global markets, supply chains, and geopolitical stability.
Key insights from the document:
Iran War & Strait of Hormuz Crisis: Brent crude surges to $114–$119, with the UN calling the closure a “stranglehold on the global economy.”
“The Strait of Hormuz carries approximately 20 per cent of the world’s traded oil…”
Russia–Ukraine Ceasefire Theatre: Competing unilateral ceasefires with no real negotiation progress.
US–China Trade Reset: Supreme Court overturns IEEPA tariffs; average tariffs now 33%, with a new 50% threat looming.
China Weaponises Critical Minerals: Export licence approvals fall below 25%, causing sixfold price spikes.
“China controls approximately 90 per cent of global rare earth processing…”
Federal Reserve Stagflation Standoff: Four-way dissent inside the Fed — the most since 1992.
IMF Global Growth Warning: Growth cut to 2%, below the recession threshold, with inflation above 6%.
This video explains how these crises interact, amplify one another, and reshape the strategic landscape for governments, investors, and corporations.Show More

Now Playing
Global Crisis 2026: Energy Shock, US‑China Tariffs, Fed Turmoil & AI Power Shift
The 2026 SVELTE Global Intelligence Report reveals a world entering a ...
The 2026 SVELTE Global Intelligence Report reveals a world entering a high‑entropy strategic cycle shaped by overlapping geopolitical, economic, and technological shocks. This video breaks down the five critical outliers ...reshaping global markets, M&A strategy, energy security, and geopolitical risk.
Key insights from the report include:
Why 2026 marks a structural break in global risk modelling
How energy and tariff shocks combine into a dual‑cost crisis
Why M&A synergy models are mispriced in the current environment
How geopolitical fractures are reshaping investment strategy
Why AI consolidation is accelerating faster than expected
If you’re an investor, strategist, analyst, or decision‑maker, this is essential intelligence for navigating the year ahead.Show More

Now Playing
Global Economic Fragility Explained | Risks Investors Should Watch in 2026
The global economy in 2026 is showing signs of weighted fragility — a ...
The global economy in 2026 is showing signs of weighted fragility — a structural weakness that builds slowly and then breaks suddenly.
In this video, we explain what weighted ...fragility is, how it affects investors and financiers, and why local economies feel the impact first.
You’ll learn:
* What “weighted fragility” means in economic terms
* Why global markets are becoming more unstable
* How systemic risk spreads across countries
* What investors should watch in 2026
How local economies are affected by global shocks
If you want to understand the global economy — and how it affects you locally — this channel is for you.
Subscribe for more insights on:
global economics, finance, investment strategy, and macro trends.Show More

Now Playing
Market Fragility
How the financial market is fragile and what to look for (4th April 2026)

Now Playing
Systemic Shocks - Financial Crisis
If you deal in finance or investment, this in depth report on global ...
If you deal in finance or investment, this in depth report on global finance will have you reconsider your investments. https://www.ncmpl.net/insight-matrix

Now Playing
Economics - the Global Crisis 260326
Understand the deep details of what is happening to the global economy ...
Understand the deep details of what is happening to the global economy and why. How the Iran War fits with US Treasury fails.

Now Playing
The Global SVELTE Financial Report 250326
Stagflation or panic? The global economic position explained simply.

Now Playing
Global Crisis Recalibration: Regional War Risk, LNG Shock & Fed Reversal | 2026 Intelligence Brief
The last 72 hours have triggered a massive strategic recalibration ...
The last 72 hours have triggered a massive strategic recalibration across global markets, energy systems, and geopolitical risk models. As of March 24, 2026, core assumptions about global stability have ...fractured — and the world analyzed even one week ago no longer exists.
This briefing breaks down the cascading shocks now reshaping the global operating environment:
Key developments covered in this analysis:
A full-blown regional war scenario with a closed Strait of Hormuz is now the central base case
Probability of regional conflict more than doubled between March 20–23
Iraq declares force majeure on oil exports
The U.S. issues an ultimatum to Iran, escalating a nuclear‑adjacent crisis
Attack on Qatar’s LNG facility removes 17% of global LNG supply for up to five years
Gold prices collapse, as inflation fears push investors toward a stronger USD
Markets shift from expecting rate cuts to a 52% probability of a Fed hike by October
Gold ETFs record $4.2B in outflows in one week
M&A and capital strategy must shift to binary event protocol:
Pause new commitments
Monitor U.S.–Iran ultimatum
Activate stagflation stress tests
Updated M&A playbook:
Avoid Gulf/Asian supply chains exposed to kinetic risk
Prioritize renewables, grid storage, and resilient infrastructure
Nuclear escalation risk: pause all activity if Israel strikes Iranian facilities
A fragile five‑day diplomatic window closes around March 28
Competitive advantage now comes from balancing immediate crisis threats with structural long‑term opportunities
This is a comprehensive, data‑driven breakdown of the most volatile geopolitical and macroeconomic environment since the early 2000s — and what decision‑makers must monitor in the next 120 hours.Show More

Now Playing
Global Stagflation Alert: Jobs Collapse, Energy Shock & Credit Crisis Signals (2026 Breakdown)
The February 2026 economic data confirms a global stagflation shock is ...
The February 2026 economic data confirms a global stagflation shock is underway. The U.S. economy lost 92,000 jobs — the worst monthly decline since 2020 — while energy prices surged ...and credit markets tightened. This video breaks down the numbers, the risks, and the global contagion now spreading across major economies.
What this video covers:
92,000 U.S. jobs lost vs. +50,000 expected — a major labor‑market reversal
WTI crude jumps 6% after the Strait of Hormuz closure, hitting a 13‑month high
New 15% global tariff driving price increases across most Federal Reserve districts
The U.S. enters stagflation: job losses + rising energy and goods prices
The Fed faces a dual‑mandate trap: cutting rates fuels inflation; holding rates deepens layoffs
Traditional recession playbooks no longer work in this environment
Unemployment at 4.4%, nearing the Sahm Rule recession trigger at 4.5%
Credit spreads widen as markets price in both recession and the energy shock
Global spillover effects:
Australia & New Zealand hit via variable‑rate mortgage stress
UK energy costs spike due to low gas storage
Switzerland’s strong CHF threatens its export‑dependent economy
Risk of “Volmageddon 2” if an emergency Fed cut collides with high inflation
The global system is moving from stagflation (phase 1) to credit crisis (phase 2)Show More

Now Playing
Stagflation Trap: How Inflation + Slow Growth Threaten the UK Economy in 2026
The UK is entering what economists call a stagflation trap — a ...
The UK is entering what economists call a stagflation trap — a dangerous mix of rising prices and slowing economic growth. This video breaks down what stagflation is, why it ...matters, and how it could reshape the British economy in 2026 and beyond.
You’ll learn:
What stagflation actually means
Why inflation remains sticky even as growth slows
How rising costs impact households, businesses, and government budgets
Why traditional economic tools struggle in a stagflation environment
What indicators to watch in the coming months
Stagflation is one of the hardest economic conditions to escape. Understanding it now helps you prepare for what’s ahead.
If you want more breakdowns on global economics, inflation trends, and financial risk analysis, subscribe and stay updated.Show More
Contact New Corporation Today for A Free Consultation About Your Business


